Bitcoin Dips Before Jobs Data, Raising Fears of Fourth Drop
Bitcoin dipped below its 200-day average ahead of the U.S. October jobs report, raising market concerns about a potential fourth consecutive weekly drop and possible Federal Reserve rate hikes.
On Friday, November 6, Bitcoin entered the U.S. October jobs report at 8:30 a.m. ET following a Thursday close of $76,088. This placed the BTC USD price below its 200-day average for the initial time since August 19.
While the report itself has historically been unpredictable, recent trends have not been.
🚨 MARKET ALERT: U.S. UNEMPLOYMENT DATA DROPS TODAY AT 8:30 AM ET! 🇺🇸
Advertisement
One number could influence today's market reaction.
📊 Unemployment Rate • Previous: 4.2% • Forecast: 4.2% Here's what I'm watching: 🔹 Above 4.2% → A weaker labor market could ease rate-hike concerns and… pic.twitter.com/6Zu5ewzubQ
— OwenCarter (@OwenCarter0el) November 6, 2026
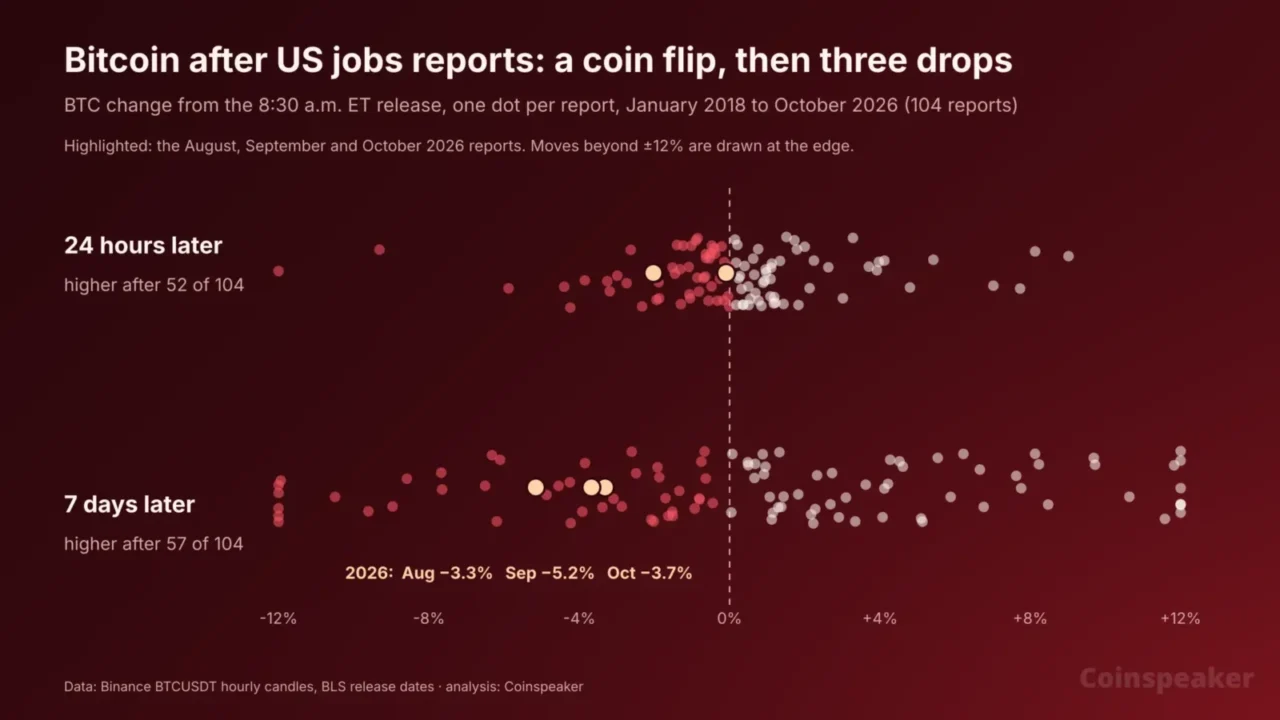
An examination of all 104 employment reports dating back to January 2018 by Coinspeaker indicates that Bitcoin traded higher 24 hours later following precisely 52 of those releases. However, looking out one week, BTC declined after each of the past three reports: losing 3.3% in August, 5.2% in September, and 3.7% in October.
Market conditions are already subdued. Bitcoin is trading at $76,160, marking a 24-hour drop of 5.1%, after a chip-stock sell-off on Thursday pulled valuations down from $80,918 to $75,208—its weakest point since September 16. Concurrently, the Crypto Fear & Greed Index plummeted from 50 to 28 within a single day.
Furthermore, employment figures feed directly into Federal Reserve policy. Polymarket traders currently price a 69% probability of a rate hike on December 9, dropping from an 80% expectation the previous day.
This raises questions about Bitcoin’s typical reactions to employment data and its prospects for reclaiming the 200-day moving average line.
Market Intelligence: Crypto Analyst Predicts Best Low-Cap Crypto
What Does Bitcoin Do After a Jobs Report?
Immediate first-day direction offers little predictive certainty, with trends only beginning to materialize after a week, and even then only mildly.
Data measurements tracked BTC from the hourly candle of each 8:30 a.m. ET release on Binance, referencing the Bureau of Labor Statistics publication archive. The October 2025 release is excluded due to a government shutdown.
First hour: higher after 58 out of 104 reports, showing an average movement of 0.66% in either direction.
24 hours: higher following 52 releases, with a median shift of +0.07% and an average swing of 1.92% either way.
7 days: higher following 57 reports, yielding a median gain of 0.67%.
The year is split in half contextually. Bitcoin finished higher a week after every single employment report during the first seven months of 2026, seeing gains between 0.5% and 7.6%, before declining following all three releases since August.
One important caveat is that a seven-day window allows outside news events to impact price action. The most severe 24-hour drop in the dataset occurred following the December 2021 report, registering a 17.1% correction alongside a weekend leverage flush.
DISCOVER: Fed Meeting Today: Traders Price a 95% Hold and a 79% December Hike. What Does It Mean for Crypto?
Bitcoin News: Why This Jobs Report Matters for the Fed
The central bank leans toward tightening rather than easing. Rates were maintained at 3.75% to 4% on October 28 via a 10–2 vote, with both dissenting members advocating for a quarter-point hike.
Thursday’s market downturn already softened those expectations. Kalshi projections for a December rate hike fell by 10 points in 24 hours, while expectations for a hold expanded from 22% to 32%.
A robust employment report would likely drive rate-hike probabilities back upward. Conversely, a soft report could grant the Fed breathing room to pause, eliminating a primary catalyst for risk-asset sell-offs.
DISCOVER: Bitcoin Holds $79,200 Before the Fed, Coinbase Earnings and a $10.9B Expiry: Which Way Next?
BTC Price Analysis: Can Bitcoin Reclaim Its 200-Day EMA?
At present, no. BTC trades roughly $380 beneath its 200-day exponential moving average (EMA) of $76,540—a threshold it previously sustained on every daily close subsequent to its August breakout.
Resistance: $76,540 (the 200-day EMA), followed by $79,839 (the 50-day EMA). Beyond that sits $81,196, which was Wednesday’s peak.
Support: $75,208 (Thursday’s low), then $74,968 (the September 15 low). Further down rests $72,598, marking the 0.5 Fibonacci retracement level.
BTCUSDT 1D chart. Source: TradingView
Outlook
Trigger
Level to watch
Rebound
A daily close back above $76,540
$79,839, the 50-day EMA
Holding pattern
BTC stays between $74,968 and $76,540
Range trade while traders digest the jobs data
Sell-off
A daily close below $74,968
$72,598, the 0.5 Fibonacci level
Historically, employment figures rarely dictate Bitcoin’s intraday direction. For participants monitoring Bitcoin developments, the weekly close relative to the 200-day EMA carries greater significance than the headline payroll figures.