
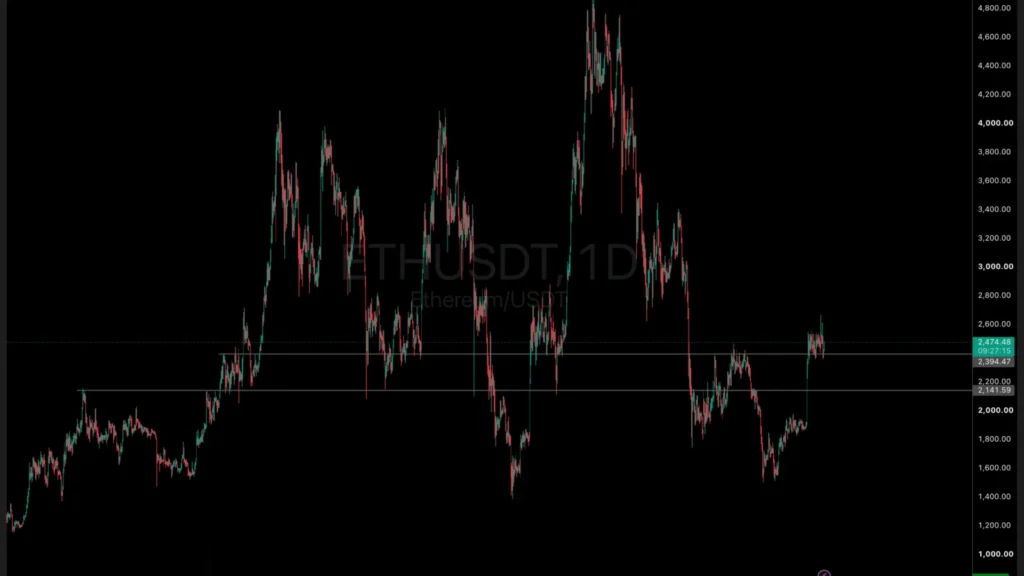

Ethereum changes hands near $2,440, marking a 1.7% gain over the prior 24 hours despite a backdrop of negative headlines. The asset is maintaining its position above the $2,400 threshold, successfully absorbing a pair of events that could have otherwise provoked a steeper decline.
Those developments include a 25-basis-point interest rate hike from the Federal Reserve alongside the Senate’s failure to pass the CLARITY Act. Current Ethereum updates place the Relative Strength Index at 53, signaling market consolidation rather than extreme momentum in either direction.
The Federal Reserve increased its benchmark interest rate by 25 basis points on Wednesday—marking its inaugural hike in three years—to establish a federal funds target range of 3.75% to 4.00%. The Federal Open Market Committee approved the adjustment unanimously.
The final tally was 12-0, with policymakers emphasizing that lowering inflation remains their primary goal. Most officials anticipate an additional rate increase prior to the conclusion of the year. The adjustment was largely anticipated by markets, as CME FedWatch probabilities sat above 90% leading up to the gathering following upward ticks in both producer and consumer inflation figures during the previous week.
JUST IN: 🇺🇸 Standard Chartered expects U.S. Fed to deliver a 25 bp rate hike in December. pic.twitter.com/ikiKRrpkmS
— Whale Insider (@WhaleInsider) September 17, 2026
Meanwhile, momentum for the CLARITY Act stalled in the Senate on Tuesday after failing to attain the 60 votes required to shut off debate. Traders and investors had largely factored this outcome into their expectations as well, which may account for the minimal immediate price reaction while simultaneously prolonging regulatory ambiguity for digital assets listed in the United States. Readers looking to examine the legislative mechanics more thoroughly can review the Senate stall on the CLARITY Act for additional context on the measure’s current status.
Market Intelligence: Crypto Analyst Predicts Best New Crypto to Hodl
Ethereum Price: Technical Levels Defining the Recovery
ETHUSDT Chart 1D
In recent Ethereum developments, ETH has successfully reclaimed the 20-day Exponential Moving Average alongside the $2,431 horizontal threshold, both of which have served as vital support regions over the past month. A Stochastic indicator reading of 26 reinforces the consolidative outlook indicated by the RSI, implying that buying momentum has cooled from previous overbought conditions without experiencing a breakdown.
Immediate resistance is positioned at $2,544, with subsequent upward targets extending toward $2,626 and $2,786 if buyers manage to keep the price above the near-term moving average band. Looking downward, the 50-day and 200-day EMAs located at $2,282 and $2,269 constitute the next line of defense, followed by $2,172, the 100-day EMA at $2,163, and $1,961. Further perspective on market momentum can be found in Ethereum’s wider Q3 recovery narrative.
$ETH supply on exchanges is falling sharply while price is going up.
Supply shock incoming? pic.twitter.com/MSUh6GkrVx
— Crypto Rover (@cryptorover) September 17, 2026
How Much Can ETF Selling Hurt ETH’s Rebound? Exchange Outflows Hit a Three-Month High
Ethereum Liquidations Coinglass
Exchange netflow metrics gathered by CryptoQuant reveal that outflows surpassed inflows by more than 152,000 ETH on Tuesday, registering the highest figure recorded since June. This occurred prior to a brief period dominated by inflows on Wednesday before outflows resumed. Net withdrawals from trading platforms are typically interpreted as an accumulation indicator, though the metric offers suggestive rather than definitive insights on its own.
Additionally, the Taker Buy Sell Ratio—which evaluates aggressive acquisition versus liquidation within perpetual swap markets—returned to positive territory after dipping below 1, according to CryptoQuant data.
Total ETH liquidations hit $221 million on Tuesday, with long positions comprising 88% of the total, before contracting to $87.6 million over the subsequent 24-hour window, driven primarily by $45.4 million in short liquidations. Open interest remained stable near 13 million ETH, and funding rates drifted back into positive territory.
Trade On The Most Trusted Exchange in Crypto
Ethereum News: ETF Outflows Threaten the Recovery, Making $2,431 the Level That Decides ETH’s Next Move
Ethereum ETF Flows Coinglass
Conversely, U.S. spot Ethereum exchange-traded funds experienced $224.1 million in net withdrawals on Wednesday, following an outflow of $141.4 million on Tuesday.
These consecutive sessions of negative flows contrast sharply with the underlying strength observed in derivatives and platform netflows. This pattern parallels similar trends highlighted regarding Bitcoin’s ETF outflow pressure surrounding the Federal Reserve’s rate announcement.
Maintaining a position above $2,431 alongside the 20-day EMA leaves the door open for a move toward $2,544, followed by $2,626 and $2,786, provided that ETF redemption activity does not intensify.
Conversely, breaking below the $2,431 support level would undermine the recovery outlook, placing the $2,282 and $2,269 EMA cluster back into view. In the event of persistent institutional sell-offs alongside current monetary and regulatory conditions, deeper downside levels rest at $2,172, $2,163, and $1,961.
Market Intelligence: Crypto Analyst Predicts Best New Crypto to Hodl
next