Bitcoin rebounded above $62,000 as silver and gold experienced steep plunges, wiping out $1.4 trillion. However, ETF data shows no capital rotation from precious metals into Bitcoin, with buyers remaining hesitant.
In current developments on November 19, silver and gold are continuing their downward slide, while Bitcoin maintains its position near $63,800. BTC has rebounded from the $62,000 threshold twice within a four-day span, prompting questions about whether the cryptocurrency sell-off is losing momentum and capital is beginning to flow back into digital assets.
Silver futures concluded Wednesday at $45 per share, marking a 4.8% daily drop and a 14% decline since November 9, alongside a further 3.2% decrease in gold.
JUST IN: $1,400,000,000,000 wiped out from Gold and Silver in the past 24 hours. pic.twitter.com/NwLlK9b1iv
Advertisement
— Whale Insider (@WhaleInsider) November 19, 2026
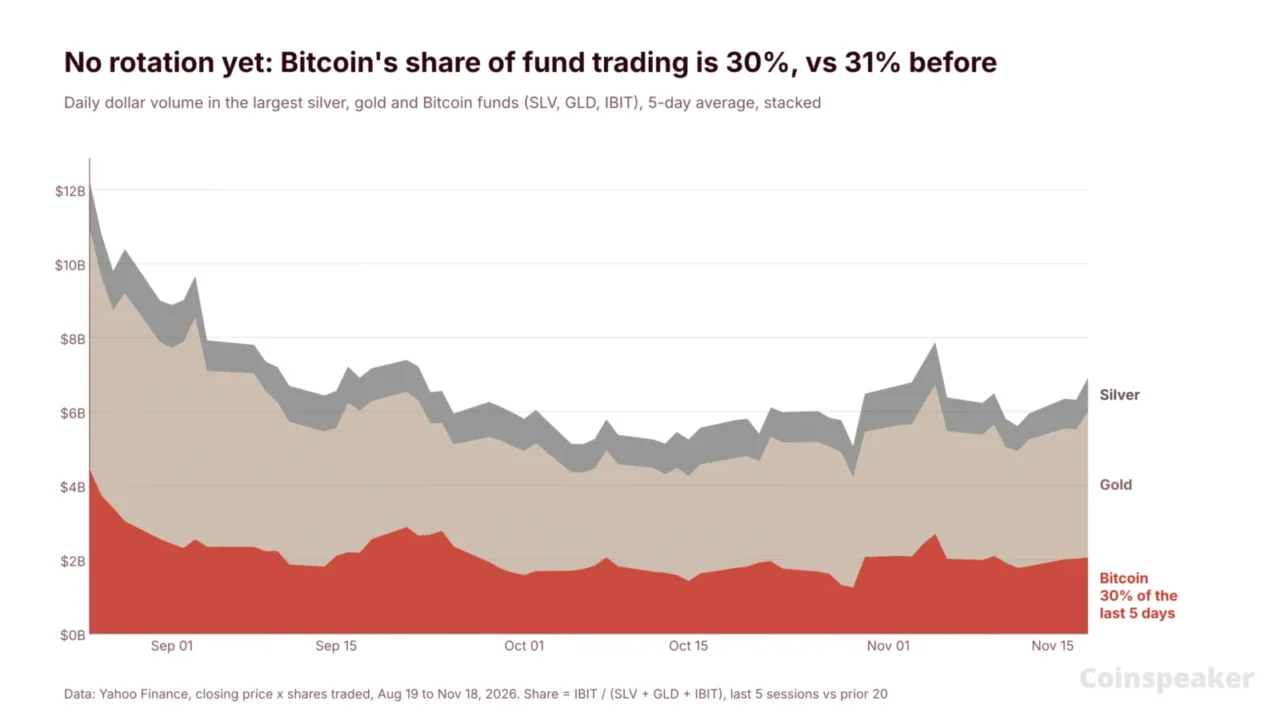
For market participants following these trends, the intuitive assumption is that capital is migrating from precious metals into cryptocurrencies. This hypothesis was tested by examining daily trading volumes across the three largest U.S. exchange-traded funds representing silver, gold, and Bitcoin. If a rotation were underway, Bitcoin’s proportion of that collective trading volume would increase.
Presently, that shift has not materialized: Bitcoin accounted for 30% of the combined trading turnover over the preceding five sessions, remaining steady compared to the 31% share recorded over the prior 20 days.
Furthermore, Bitcoin’s recovery occurred on lighter trading volume than the preceding downward move, indicating that buyers remain hesitant.
Consequently, it remains unclear whether this marks the beginning of a rotation from metals to crypto or merely a temporary pause in selling pressure.
Bitcoin News: Fund Trading Shows No Shift From Metals to Crypto
Exchange-traded funds (ETFs) provide a clear indicator of U.S. capital flows because they trade concurrently on identical platforms. An analysis of the three largest funds—the iShares Silver Trust (SLV), SPDR Gold Shares (GLD), and BlackRock’s iShares Bitcoin Trust (IBIT)—was conducted by multiplying each fund’s closing price by its daily share volume to determine total dollar turnover.
Bitcoin’s share is flat: IBIT captured 30% of the total dollars traded across the three funds over the past five sessions, matching the 31% recorded across the previous 20 sessions.
Metals trading rose: On Wednesday, $1.17 billion worth of SLV shares changed hands—representing a 33% increase over its 20-day average—while GLD registered $4.38 billion in volume, likewise climbing roughly one-third above normal levels. Elevated trading volume during a declining market typically reflects aggressive liquidation by investors.
Bitcoin trading held steady: IBIT turnover reached $1.98 billion on Wednesday, aligning closely with its 20-day average of $1.90 billion.
Accordingly, capital exiting silver and gold is not currently appearing in Bitcoin funds. The activity appears to reflect a broader liquidation affecting both asset classes, with precious metals currently enduring the heavier blow.
Market Intelligence: Crypto Analyst Predicts Best Low-Cap Crypto
The $62K Bounce Came on Thin Volume: What Does That Imply?
Data from Binance’s BTCUSDT trading pair reflects a parallel trend on the cryptocurrency side. During the decline from November 13 to 15, the pair averaged $2.0 billion in daily volume. Over the subsequent three days, as Bitcoin sustained levels above $62,000, that average receded to $1.5 billion.
Reduced trading activity during a price recovery indicates a scarcity of incoming buyers. While selling has abated, purchasing demand has yet to return forcefully.
Spot Bitcoin ETFs, which hold the underlying asset directly, exhibit a comparable dynamic. IBIT recorded $76.5 million in inflows on November 16, marking its initial positive flow following an 11-day outflow streak. While notable, this represents a single day of accumulation following a two-week distribution phase.
US BTC Spot ETF Sosovalue
Both markets are influenced by a common driver: the U.S. Federal Reserve. Market participants anticipate another interest rate increase in December, and elevated rates tend to penalize non-yielding assets ranging from silver to Bitcoin. Until that macroeconomic stance evolves, capital rotation between these asset classes lacks a strong catalyst.
EXPLORE: Bitcoin ETF Inflows Return After Seven-Day Losing Streak as IBIT Adds $76.5M: Is the Sell-Off Finally Over?
Bitcoin Price Analysis: $62,300 Held Twice
On the daily timeframe, Bitcoin changes hands at $63,713. This places the price beneath its 50-day exponential moving average (EMA)—which assigns greater weight to recent prices—at $75,245, and beneath its 200-day EMA at $75,624.
Support: $62,300. Bitcoin established support near this zone on Sunday and once more on Wednesday, following successful tests in February, June, July, and August. The subsequent support level resides at $57,800, representing the July low.
Resistance: $65,500, a threshold that acted as a rebound point in early 2026 and capped rallies in June, July, and August. Further overhead resistance is situated at $74,300.
BTCUSDT 1D chart. Source: TradingView
Outlook
Trigger
Level to watch
Rebound
A daily close above $65,500 on rising volume
$74,300, the March-September level
Holding pattern
Price stays between $62,300 and $65,500
A range near current levels
Sell-off
A daily close below $62,300
$57,800, the July low
Market observers should monitor trading volume for future directional clues. A sustained break above $65,500 accompanied by daily turnover returning toward $2 billion would mark an initial shift. Confirmation of capital moving from metals to crypto would require IBIT’s share of fund trading to surpass one-third.
Market Intelligence: Crypto Analyst Predicts Next Crypto to Hit 1 Dollar