
Bitcoin experienced a downward price movement following the U.S. market close, sliding from $74,811 to $73,480 within a two-hour window. The cryptocurrency dipped overnight after two distinct shocks impacted U.S. markets following Wednesday’s closing bell. Nvidia shares dropped roughly 9% in after-hours trading due to a new report concerning CEO Jensen Huang, while index provider MSCI confirmed plans to remove Strategy—the largest corporate holder of Bitcoin—from its global indexes.
By Thursday morning on Binance, the asset traded at $73,588, reflecting a 0.4% decline over 24 hours and a 5.8% drop across the week.
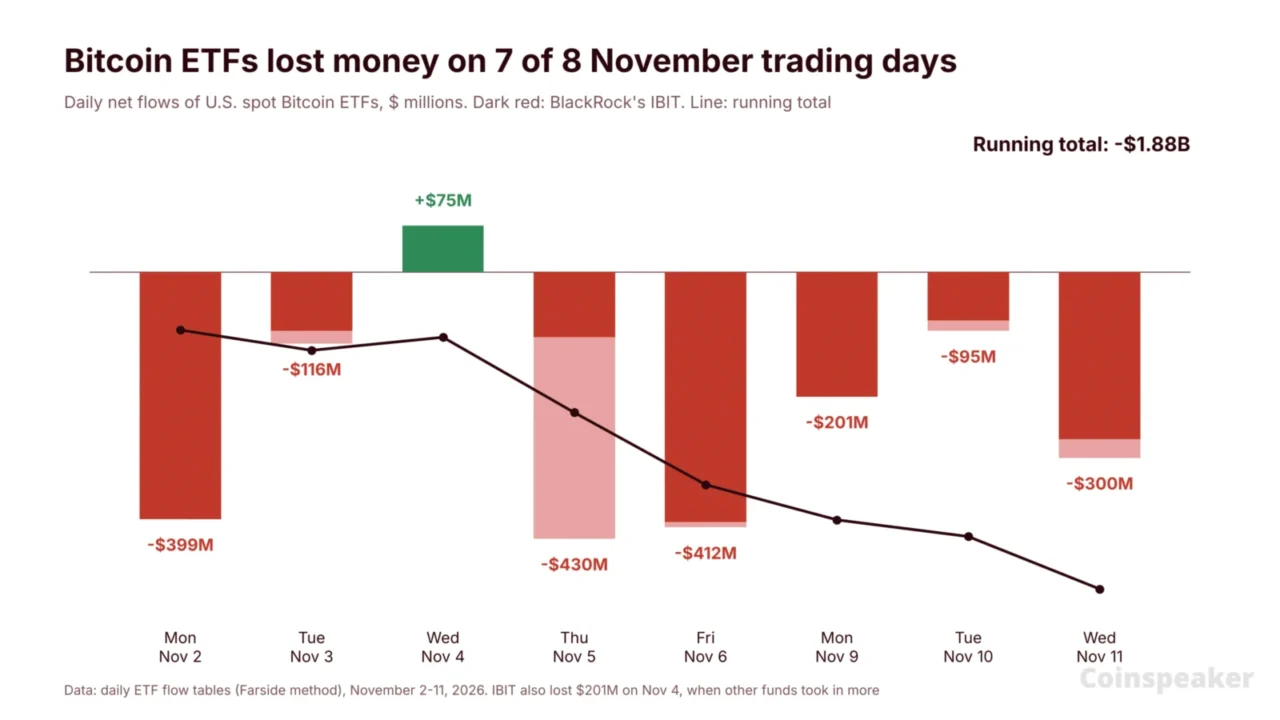
Fund flows continue to provide headwinds. U.S. spot Bitcoin exchange-traded funds (ETFs) shed $299.8 million on Wednesday, marking their fifth consecutive day of outflows. Simultaneously, Nasdaq futures declined by 0.9%.

Bitcoin ETFs Shed $300 Million, Ether Funds Lose $145 Million
According to SoSoValue, U.S. spot Bitcoin ETFs recorded $300 million in net outflows on November 11, while Morgan Stanley's MSBT led individual fund inflows with $8.96 million. Spot Ethereum ETFs saw $145 million in… pic.twitter.com/5sn88B2JQX
— Wu Blockchain (@WuBlockchain) November 12, 2026
So what happened, and how much of the selling comes from the ETFs?
Two Shocks After the Close: Nvidia and MSCI
The initial blow originated from Nvidia, the world’s most valuable chipmaker. On Wednesday evening, The New York Times reported that Huang maintained a second relationship with a senior employee reporting to him. Following this, The Wall Street Journal reported that Nvidia’s board is preparing to strip him of his CEO title.
Nvidia had concluded the trading day up 2.9% at $173.73. Within two hours, the stock changed hands at $157.99, plunging 9.1%. It remained down 8.6% ahead of Thursday’s opening bell, bringing Nvidia’s total losses to approximately 15% since the previous Friday. The decline initially began on Monday after the company’s board initiated a separate investigation into reports that Huang had been targeted by a foreign intelligence operation.
Because Bitcoin has correlated closely with technology equities throughout the year, it retreated alongside them. Over the same two-hour period, Nasdaq 100 futures fell by 1.1%.
The secondary blow carries more direct implications for the cryptocurrency sector. MSCI, whose benchmarks dictate the allocation of trillions of dollars in index funds, announced it will delete Strategy from its global indexes after the market close on November 30. The provider determined that Strategy functions more like an investment fund holding Bitcoin than an active operating enterprise. Japan-based Metaplanet and Upexi are also slated for removal.
Consequently, funds tracking those specific indexes will be compelled to liquidate their Strategy shares. JPMorgan previously estimated this mandatory selling pressure at roughly $2.8 billion. Strategy reports that these funds control about 13 million shares, representing 3.1% of its total stock. Company shares traded down 1.8% prior to the market open.
For the broader digital asset landscape, this development extends past a single corporate entity. Strategy stands as the most consistent corporate buyer of Bitcoin. A reduction in index-driven buyers for its equity could complicate and increase the expense of raising capital for future cryptocurrency acquisitions.
Market Intelligence: Crypto Analyst Predicts Best Low-Cap Crypto
Bitcoin News From the ETFs: Seven Red Days Out of Eight
Outflows from ETFs predated both market shocks. To gauge the magnitude of the ETF sector’s impact, the daily net flows of U.S. spot Bitcoin ETFs were aggregated for every trading session in November.
- Red days: Seven out of the eight trading sessions thus far have recorded net losses. November 4 was the sole exception, pulling in $74.6 million.
- Total: A cumulative $1.88 billion has exited these funds during the month, with the past five days alone responsible for $1.44 billion of that total.
- Who is selling: BlackRock’s iShares Bitcoin Trust (IBIT), the largest fund in the category, accounted for $1.77 billion in outflows—representing 94% of the aggregate total. On Wednesday alone, it shed $269.7 million out of the $299.8 million total market outflow.
This negative streak has not yet broken historical records; the longest consecutive run of outflows this year spanned 13 trading days across May and June, occurring right before Bitcoin dipped beneath $60,000.
Monetary policy adds further strain. Tuesday’s hotter-than-expected October inflation report elevated the implied probability of a December interest rate hike on Polymarket to roughly 97%. Elevated interest rates enhance the yield on cash and fixed-income assets, which historically draws capital away from vehicles like spot crypto funds.
EXPLORE: Why Is Crypto Crashing Today? Bitcoin Falls Below $73K as Zcash (ZEC) Leads Crypto Losses
Bitcoin Price Analysis: Can BTC Hold $72,727?
BTC currently changes hands at $73,588, maintaining position above Tuesday’s low of $72,727, which marks its weakest price point since August 20. On the daily timeframe chart—where each candlestick represents a single day—the asset trades below both of its key exponential moving averages (EMAs), which assign greater statistical significance to recent price action. The 50-day EMA sits at $78,696, while the 200-day EMA rests at $76,422.
- Resistance: Wednesday’s peak at $74,811 acts as the first hurdle, followed by the 200-day EMA at $76,422, and subsequently the 50-day EMA at $78,696.
- Support: Wednesday’s low of $73,390 serves as immediate support, followed by Tuesday’s low of $72,727. Beneath that lies the August 20 trough at $68,902.
BTCUSDT 1D chart. Source: TradingView.
| Outlook | Trigger | Level to watch |
|---|---|---|
| Rebound | A daily close above $74,811 accompanied by returning ETF inflows | The 200-day EMA at $76,422 |
| Holding pattern | BTC oscillates strictly between $72,727 and $74,811 | A sideways range persisting until Nvidia-related and ETF redemption pressures subside |
| Sell-off | A confirmed daily close below $72,727 | The August 20 low at $68,902 |
Upcoming market indicators to monitor include Thursday’s ETF flow statistics alongside Nvidia’s performance at the opening bell. A sixth successive day of fund outflows alongside sluggish technology sector activity would place the $72,727 support level under direct examination.
Market Intelligence: Crypto Analyst Reveals Upcoming Coinbase Listingss