
Within five minutes of the U.S. October consumer price index (CPI) report on Tuesday, Ripple XRP dropped to $1.05 as the XRP USD price climbed faster than economists had anticipated.
At 8:30 a.m. New York time (13:30 UTC), when the report was released, the XRP crypto was trading at $1.0797. By 13:35 UTC, it reached $1.0500 on Binance, marking a 2.8% decline and hitting its lowest price since August 19. It has since recovered to roughly $1.07. Concurrently, Bitcoin experienced a similar drop, falling to $73,525 during those same five minutes.
This decline brings XRP back to a price threshold it has previously tested. From late June through mid-August, XRP hovered around $1.05 for multiple weeks, successfully holding the level on the first occasion but breaking below it on the second.

Consequently, the questions remain whether this support will endure and what the CPI data indicates.
BREAKING: October CPI inflation rises +0.4% month-over-month, above expectations of +0.3%.
Core CPI inflation rose +0.3%, also above expectations of +0.2%.
BLS will not be releasing year-over-year figures due to the October 2025 government shutdown.
Inflation still appears to…
— The Kobeissi Letter (@KobeissiLetter) November 10, 2026
The CPI Numbers Point to a Bigger Fed Rate Hike: But What Does CPI Mean for XRP?
October consumer prices outpaced forecasts, with the Bureau of Labor Statistics reporting a 0.4% increase for the month compared to the 0.3% rise predicted by economists.
Core prices—which exclude volatile food and energy sectors—increased by 0.3%, beating the 0.2% forecast. Core inflation has maintained a roughly 0.3% monthly pace for three consecutive months.
The report lacks its usual year-over-year figure because the bureau did not collect pricing data in October 2025 during the government shutdown, leaving the monthly statistics to represent the entire report.
These monthly figures hold significant weight for the Federal Reserve. Federal Reserve Governor Christopher Waller stated in a morning speech that he already favors a 0.25 percentage point rate reduction in December, but added that if core CPI printed at 0.3% once more, a 0.5-point increase “should be considered.”
With core CPI landing at 0.3%, traders had previously priced in virtually no probability of such a substantial rate hike. Higher interest rates increase the yields on cash and bonds, which typically draws capital away from speculative assets such as XRP.
Market Intelligence: Crypto Analyst Predicts Next Crypto to Hit 1 Dollar
Ripple XRP Has Usually Recovered a Day After a Hot CPI: Will the Pattern Repeat?
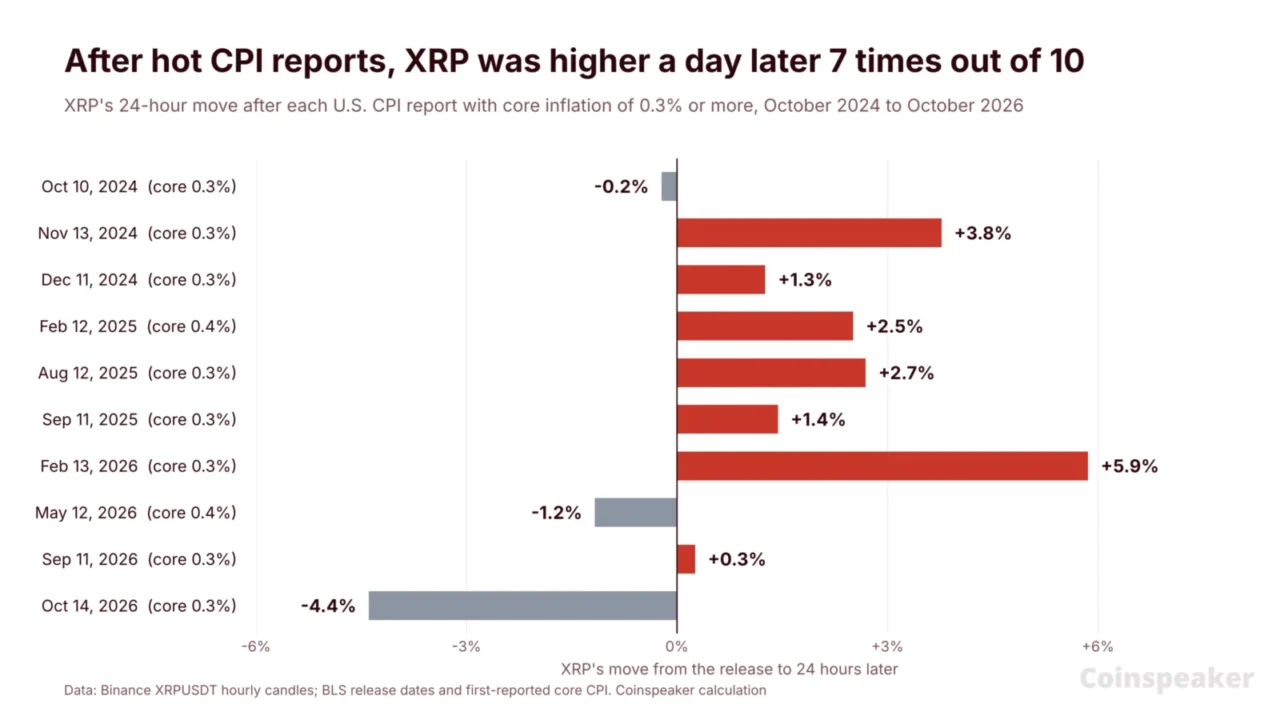
Historically, the initial reaction to an inflation-heavy report tends to dissipate. An analysis of XRP’s Binance prices during the 24 hours following each of the previous 24 CPI releases—spanning from October 2024 to October 2026—illustrates this trend.
Ten of those reports featured core inflation rates of 0.3% or higher, mirroring today’s figures. Following seven of those instances, XRP traded higher 24 hours later, registering a median gain of 1.4%.
However, performance has softened throughout the year. Out of the four hot inflation reports in 2026, XRP traded higher a day later on only two occasions. Following the most recent report on October 14, the asset dropped 4.4% over a 24-hour period.
The distinguishing factor this time is the stance of the Federal Reserve. While a hot inflation report that merely confirms a minor rate adjustment is easily absorbed by traders, one that introduces the possibility of a larger hike—as outlined by Waller—provides downward pressure for sellers.
EXPLORE: XRP Price Forecast: Ripple at Risk of Losing Key Support, $1 Next?
The $1.05 Support Has Held Once and Broken Once
This price level carries a notable history over the course of the year, with XRP spending two extended periods trading near $1.05 since June.
- Late June to early July: XRP fluctuated between $1.02 and $1.07 across roughly a week, hitting a low of $1.022 on July 1 before rebounding past $1.11 the subsequent day. The support level held.
- Early August: After closing at $1.035 on August 6, XRP continued its downward trajectory, dipping to $0.986 on August 14—its most recent drop below $1—prior to recovering above $1.10 on August 19. The support level failed.
Today’s low of $1.0500 aligns precisely with that historical zone. While initial tests of a support level frequently hold, subsequent retests often deplete the remaining buyer interest.
Ripple XRP Price Analysis: Can $1.05 Hold?
Following the CPI decline, XRP changes hands at approximately $1.07 on Binance, reflecting a 2.8% decrease over 24 hours and a 17% drop across the week. The asset sits 71% below its July 2025 all-time high of $3.65.
On the daily chart, where each candlestick represents a single day, XRP trades comfortably beneath its exponential moving averages (EMAs), which assign greater importance to recent price data. The 50-day EMA sits at $1.294, while the 200-day EMA rests at $1.350.
- Resistance: $1.130 (recent swing high), followed by $1.165, and further up at the 50-day EMA of $1.294.
- Support: $1.050 (today’s low), followed by $1.022 (July 1 low), and $0.986 (August 14 low).
XRPUSDT 1D chart. Source: Binance.
| Path | What has to happen | Next stop |
|---|---|---|
| Bounce | A daily close above $1.130 | $1.165, then the 50-day EMA at $1.294 |
| Hold the floor | XRP stays between $1.050 and $1.130 | A base like late June’s |
| Break down | A daily close below $1.050 | $1.022, then $0.986 |
For Ripple XRP, the initial test of the $1.05 mark has successfully held thus far. The daily close will ultimately determine the outcome: closing above $1.05 preserves the support structure, whereas a close beneath it clears the path toward the $1 threshold.
Market Intelligence: Crypto Analyst Predicts Top Solana Meme Coins to Bid
next