
Why is the cryptocurrency market declining on Wednesday, November 11? The downward spiral, triggered by a hotter-than-expected U.S. inflation reading on Tuesday, has persisted into today, pulling nearly all major digital assets lower.
Bitcoin (BTC) dipped beneath $73,000 yesterday—touching $72,727 on Binance—and currently hovers around $73,800. Meanwhile, Ether (ETH) momentarily dipped to $2,006, and both XRP and Solana (SOL) have registered 24-hour losses of 2% to 3%. Furthermore, the Crypto Fear & Greed Index, a daily sentiment barometer scaled from 0 to 100, has declined to 29.
The latest data release has shifted market expectations regarding the Federal Reserve’s monetary policy. Consequently, bond yields surged, and market probabilities for a more substantial December interest rate increase nearly tripled within a two-hour window.

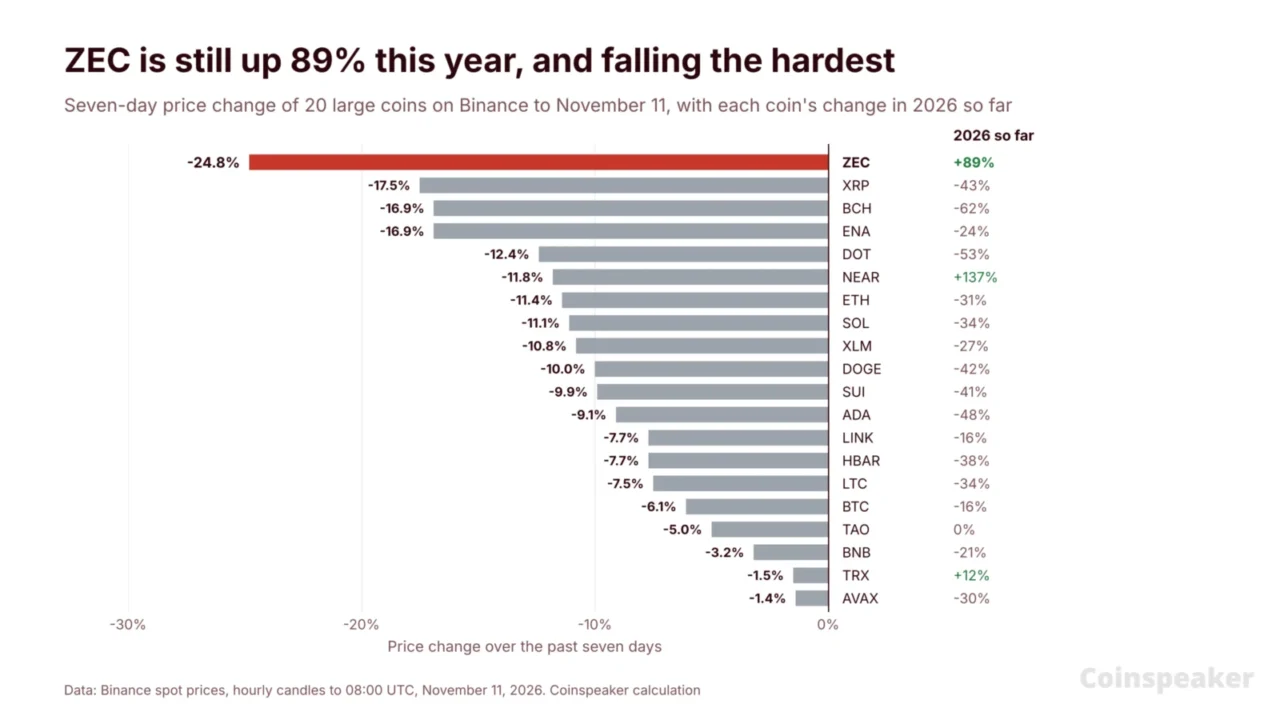
However, one particular asset is experiencing a much steeper descent. Zcash (ZEC)—a privacy-focused cryptocurrency introduced in 2016 that conceals senders, receivers, and transaction amounts—fell under $1,000 on Wednesday for the first time since September 5. ZEC is presently valued at approximately $966, marking a 15.4% drop over 24 hours and a 24.8% decline across the week.
Even with this downturn, ZEC remains one of the year’s top-performing digital assets, having climbed from roughly $526 on January 1 to a peak closing price of $1,653 on September 26. An evaluation of the 20 largest coins on Binance reveals that ZEC suffered the steepest losses over both daily and weekly timeframes, though it retains an 89% gain for 2026.
$ZEC has dropped below $1,000!
Trader 0x8742 opened a 10x long on 18,000 $ZEC ($17.63M) and is now down over $2.8M.
Liquidation price: $895.46.https://t.co/azzt3xvmay pic.twitter.com/wczndt7doC
— Lookonchain (@lookonchain) November 11, 2026
So why are investors feeling uneasy, and why is ZEC bearing the brunt of the sell-off?
Asking Why Is Crypto Crashing? Start With Tuesday’s CPI Report
Inflation figures exceeded forecasts. The consumer price index (CPI) advanced 0.4% in October, outpacing the 0.3% increase anticipated by economists. Similarly, core prices—which exclude volatile food and energy sectors—grew by 0.3%, surpassing the 0.2% projection.
This outcome breached a threshold previously outlined by the Fed. In an address delivered just hours prior to the report, Fed Governor Christopher Waller noted that a core inflation rate hovering around 0.3% would warrant consideration of a half-point rate cut—correction: half-point rate hike—in December.
Traders responded immediately to his remarks. On Polymarket, the implied probability of a rate increase of 0.5 percentage points or greater in December surged from 4.4% immediately before the report to 12.8% two hours afterward. Currently, those odds stand at 9.4%, while expectations for a standard quarter-point hike are priced at 85.5%.
Higher interest rates negatively impact the crypto market by increasing the yields on cash and fixed-income bonds, prompting capital to exit riskier asset classes. On Tuesday, the 10-year U.S. Treasury yield advanced from 4.86% to 4.98%.
Additional downward pressure stemmed from two other developments:
- Nvidia: Shares of the semiconductor giant dropped 5.5% to $168.89 on Tuesday, marking their lowest closing level since March 30. This decline followed a Republican senator’s public call for CEO Jensen Huang to resign over a personal affair, and the digital asset market frequently mirrors weakness in prominent AI equities.
- ETF outflows: U.S. spot Bitcoin exchange-traded funds (ETFs) experienced net outflows totaling $969 million over the preceding five trading sessions, according to tracking data from CryptoQuant contributor Axel Adler Jr. as highlighted by Lookonchain.
Market Intelligence: Crypto Analyst Predicts Best Low-Cap Crypto
Why Is Crypto Crashing? ZEC Is Falling Hardest Because It Rose the Most
ZEC had accumulated the most gains available to retrace. A comparative analysis of price shifts across 20 major Binance-listed coins over the past week and since January 1 demonstrates:
- ZEC: Down 24.8% over seven days, representing the worst performance in the cohort, yet maintaining an 89% increase for 2026.
- The rest: Aside from ZEC, only two other assets—NEAR and Tron (TRX)—remain in positive territory for the year. Meanwhile, Bitcoin has retreated 6.1% over the week and 15.9% since the beginning of January.
During periods of market anxiety, investors typically liquidate the assets that previously yielded the highest returns. ZEC has pulled back 41% from its September 26 closing high of $1,653.
The use of borrowed capital accelerated the downward movement. On Hyperliquid, ZEC slid from $1,199.20 to $965.79 within less than a 24-hour window. Lookonchain identified 32 traders maintaining leveraged long positions on ZEC valued in excess of $1 million each. Among them, 27 are currently facing unrealized losses, accumulating approximately $23.7 million in combined paper losses.
Historically, steep pullbacks have not always been permanent. Since January 2025, ZEC has dropped 12% or more during a single trading day on Binance on 14 separate occasions. Seven days later, the asset rebounded into positive territory eight times, posting a median gain of 6.5%.
EXPLORE: Fed Meeting Today: Traders Price a 95% Hold and a 79% December Hike. What Does It Mean for Crypto?
ZEC Price Analysis: Can $933 Hold Above the Whales’ Liquidation Zone?
ZEC trades near $966, having touched an intraday low of $961.07 on Wednesday, its weakest valuation since September 4.
On the daily candlestick chart, ZEC has slipped below its 50-day exponential moving average (EMA)—a trend indicator that places greater emphasis on recent price action—currently positioned at $1,200.68. However, it continues to trade above its 200-day EMA, which sits at $872.23.
- Resistance: Found at $1,050 (Wednesday’s peak), followed by $1,191.76, representing a recent swing high near the 50-day EMA.
- Support: Located at $933.12 (the September 4 low), followed by approximately $895. Data from Lookonchain indicates that two of the largest ZEC bull positions on Hyperliquid face forced liquidation near $894 and $895. Beneath those levels rests the 200-day EMA at $872.23.
ZECUSDT 1D chart. Source: TradingView.
| Scenario | Trigger | Level to watch |
|---|---|---|
| Recovery | A daily close above $1,050 | $1,191.76, near the 50-day EMA |
| Holding pattern | ZEC stays between $933 and $1,050 | A base above the September 4 low |
| Further drop | A daily close below $933 | $895, where large liquidations sit, then the 200-day EMA at $872 |
For Bitcoin, the critical threshold to monitor is Tuesday’s low of $72,727. A breakdown beneath that mark brings the next support level into view at $68,902, which matches the low from August 20.
Ultimately, the ongoing crypto market correction stems from a hotter inflation print that elevated expectations for aggressive Federal Reserve tightening, compounded by heavy liquidations among leveraged ZEC bulls. A confirmed daily close back above $1,050 would serve as the initial signal that selling pressure is subsiding.
Market Intelligence: Crypto Analyst Reveals Upcoming Binance Listings